A Statistical Analysis of Fidgeting
Many people in the US nowadays are familiar with Fidget Spinners. They’ve become somewhat of a worldwide phenomenon in the past few months. The spinner rotates around what I assume to be ball bearings in the central axis, which is gripped between the user’s forefigners. If you happen to live under a rock, they look like the following.

Fidget Spinner
One of my roommates brought a few of these home, and as we were talking, we were idly playing with the (surprisingly satisfying) spinners. We came up with a game: spin the toy on a flat surface, and attempt to jam a pencil through one of the small holes, a bit like this.
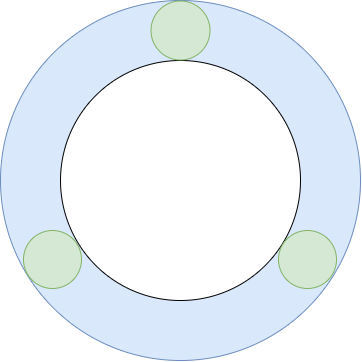
As we played the game, we started to wonder what the probability of getting the pencil in one of the holes. We should be able to calculate the probabilty by taking a ratio of areas (we assume a uniform probability density). Specifically, dividing the sum of the green areas by the blue area should give us the probability (we also assume that the pencil is aimed at the visible “ring” formed by the holes as it spins).

Our Probability Model
After calculating the areas for our specific toy, we found the P(sucess) to be 0.13 under this model. I’m taking a Statistics class at the moment, and my class just covered it, so we decided to do some hypothesis testing. We chose α = 0.05.
We took 72 samples, and found p̂ = 0.29 (σ = 0.05)! More than double what our mathematical model predicted. Calculating the statistics, we determined that we should in fact reject our model, given our p-value of 0.000095 (!).
This is strange, and we haven’t yet been able to come up with a better model. Shoot me an email if you can think of anything!